

Usage#
Introduction#
uranography is a collection of classes that supply tools for making
bokeh plots of data on the celestial sphere. It is primarily intended for
use in interactive environments such as jupyter notebooks or dashboards. For
instructions on using it in such envirenments, see the example notebook,
uranography.ipynb, in the notebooks directory of the repository.
The following examples show use in creation of non-interactive plots, saved as png files.
Although some common plots are straightforward using uranography
commands alone, in general the tools are intended as a supplement to the
using bokeh directly, and not for use use as a replacement interface
to it.
Creating test data for example use#
Begin by creating some sample data to plot, a pandas.DataFrame of
the brightest stars:
import pandas as pd

stars_df = pd.DataFrame(
   [
       {"name": "Sirius", "coords": (101.3, -16.7), "Vmag": -1.46},
       {"name": "Canopus", "coords": (96.0, -52.7), "Vmag": -0.72},
       {"name": "Arcturus", "coords": (213.9, 19.2), "Vmag": -0.04},
       {"name": "Alpha Centauri", "coords": (219.9, -60.8), "Vmag": -0.01},
       {"name": "Vega", "coords": (279.2, 38.8), "Vmag": 0.03},
       {"name": "Capella", "coords": (79.2, 46.0), "Vmag": 0.08},
       {"name": "Rigel", "coords": (78.6, -8.2), "Vmag": 0.12},
       {"name": "Procyon", "coords": (114.8, 5.2), "Vmag": 0.38},
       {"name": "Achemar", "coords": (24.4, -57.2), "Vmag": 0.46},
       {"name": "Betelgeuse", "coords": (88.8, 7.4), "Vmag": 0.5},
   ]
  )
A basic plot of points on the sky#
The uranography tools consist of a collection of classes, each of
which implements a different map projection for the sky.
In our first example, we will using the Planisphere class, which
implements Lambert Azimuthal Equal Area projection.
Begin by creating an instance of the Planisphere class, called
sky.
After instantiation, sky will have a plot member, which is a
perfectly normal instance of bokeh.plotting.Figure, and we can add
elemnts to the figure using the standard complement of members of that
class supplied by bokeh.
sky also provides transform methods that convert columns in a data
source with ra, declination pairs (in degrees) to x and y
projection coordinates.
The decorate method adds a stardard complement of “decorations” for
sky maps: graticules for R.A. and declination, the ecliptic, and the
galactic plane.
Finally, the show method of sky displays the plot (if you are
running in a jupyter notebook in which you have run
bokeh.io.output_notebook().
import bokeh.io
from uranography.api import Planisphere

sky = Planisphere()
sky.plot.star(
    sky.x_transform("coords"),
    sky.y_transform("coords"),
    source=stars_df)
sky.decorate()

# sky.show(); # If we were in a notebook
saved_file = bokeh.plotting.save(sky.figure, filename='usage_figures/basic_planisphere.html')
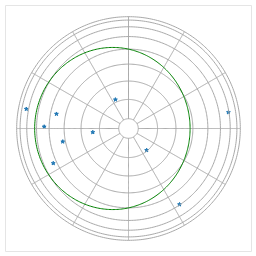
You can take greater control by instantiating instance of
bokeh.plotting.Figure yourself and passing it as an argument when
creating sky.
Also, instead of using the standard decorations supplied by
decorate, you can add the elements you want individually.
Finally, this example saves the result to a non-interactive png, rather than a interactive html.
import bokeh

plot = bokeh.plotting.figure(
    plot_width=256,
    plot_height=256,
    match_aspect=True,
)
sky = Planisphere(plot=plot)
plot.star(
    sky.x_transform("coords"),
    sky.y_transform("coords"),
    source=stars_df)
sky.add_graticules()
sky.add_ecliptic()

# sky.show(); # If we were in a notebook
sky.plot.toolbar_location = None ;# Do not show the toolbar in the saved png
saved_file = bokeh.io.export_png(sky.plot, filename='usage_figures/adjusted_planisphere.png')
Plotting a healpix map#
import healpy as hp
from uranography.api import MollweideMap

dust = hp.read_map(
    #    "https://lambda.gsfc.nasa.gov/data/foregrounds/SFD/lambda_sfd_ebv.fits"
    "lambda_sfd_ebv.fits"
)

plot = bokeh.plotting.figure(
    plot_width=512,
    plot_height=256,
    match_aspect=True,
)
sky = MollweideMap(plot=plot)
sky.add_healpix(dust)

# sky.show(); # If we were in a notebook
saved_file = bokeh.plotting.save(sky.figure, filename='usage_figures/basic_healpix.html')
Details of the plot can be adjusted either through arguments to
add_healpix or by using select to find the relevant bokeh
model and adjusting directly, as you would when fine tuning any
bokeh plot.
The healpix maps and decorations supplied by uranography have default
names that can be used to select them for adjustment, or they can be
set using arguments to their respective methods.
For example, use bokeh to use a histogram equalized grayscale color
map, with each healpixel outlined in red:
import healpy as hp
from uranography.api import MollweideMap

dust = hp.read_map(
    #    "https://lambda.gsfc.nasa.gov/data/foregrounds/SFD/lambda_sfd_ebv.fits"
    "lambda_sfd_ebv.fits"
)

plot = bokeh.plotting.figure(
    plot_width=512,
    plot_height=256,
    match_aspect=True,
)
sky = MollweideMap(plot=plot)

# Example of tweaking the appearance of the healpix map
# using arguments to add_healpix
cmap = {
    "field": "value",
    "transform": bokeh.models.EqHistColorMapper(palette="Greys256"),
}

sky.add_healpix(dust, cmap=cmap) #doctest: +ELLIPSIS

# Example of tweaking the appearance of the healpix map
# by setting members of bokeh models directly
sky.plot.select("hpix_renderer").glyph.line_color = "red"

# sky.show(); # If we were in a notebook
saved_file = bokeh.plotting.save(sky.figure, filename='usage_figures/adjusted_healpix.html')
Figures that depend on time and observer location#
Some projections and decoraction depend on the time, the location of the observer, or both.
These parameters can be passed in the creation of the instance of
SphereMap, and some can be adjusted using sliders.
Note the call of the connect_controls method after the data points
(in stars) are added to this map. This causes the project values of
the positions to be updated when the sliders are adjusted.
from astropy.time import Time
from astropy.coordinates import EarthLocation
from uranography.api import HorizonMap

current_time = Time.now()
location = EarthLocation.of_site("Cerro Pachon")

plot = bokeh.plotting.figure(
    height=256,
    width=256,
    match_aspect=True,
)
sky = HorizonMap(mjd=current_time.mjd, location=location, plot=plot)
stars = bokeh.models.ColumnDataSource(stars_df)
plot.star(
    sky.x_transform("coords"),
    sky.y_transform("coords"),
    source=stars,
)

sky.connect_controls(stars)
sky.add_horizon_graticules()
sky.add_ecliptic()

# sky.show(); # If we were in a notebook
saved_file = bokeh.plotting.save(sky.figure, filename='usage_figures/simple_horizon.html')